

In the previous articles, we covered why SFD (Shear Force Diagram) and BMD (Bending Moment Diagram) matter, as well as how to actually draw them.
In this article, we’ll take it a step further.
We’ll look at the key characteristics of SFD and BMD, and explain the four typical patterns that appear depending on the type of load applied to a beam.
Once you understand the concepts in this article, your grasp of SFD and BMD will deepen significantly.
You’ll start to sketch the general shape of diagrams without doing full calculations, and even spot calculation mistakes more easily.
Super useful stuff—so stick with me till the end.
Explore more articles on SFD and BMD here!

How to Draw SFD & BMD: Worked Example and Step-by-Step Solution
How Different Loads Appear in Shear Force and Bending Moment Diagrams (SFD and BMD)

How to Draw Shear Force and Bending Moment Diagrams (SFD & BMD) Step by Step
Shear Force Diagram & Bending Moment Diagram (SFD/BMD): What They Are and Why They Matter
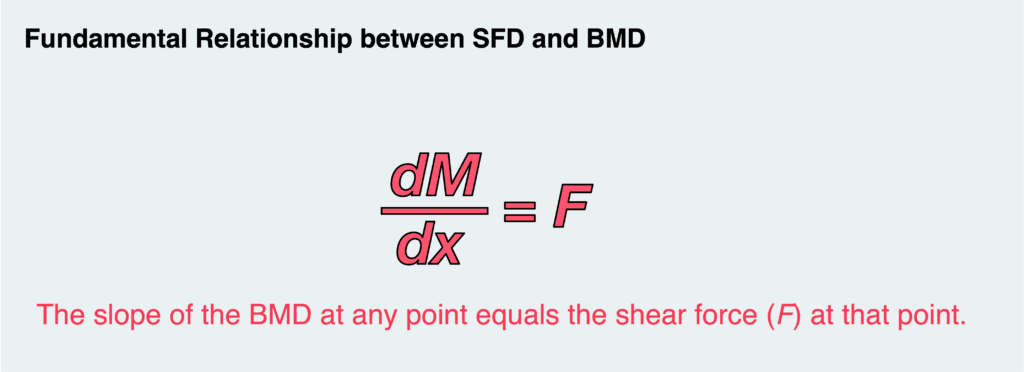
- The most fundamental relationship: The slope of the BMD equals the shear force (F) in the SFD at the same position.
- Regions with no applied load: The SFD is constant (horizontal), and the BMD is a straight line with slope F.
- Around a point load (P): The SFD shows sudden jumps (discontinuities) of magnitude P, and the BMD has a sharp corner where the slope changes by P.
- Around an applied moment (M₀): The SFD remains constant (horizontal), while the BMD shows sudden jumps (discontinuities) of magnitude M₀.
- Regions under a distributed load (q): The SFD is a straight line with slope −q, and the BMD becomes a quadratic curve.
渾身のnoteを書きました!!

「公式は覚えてるのに問題を見たら手が止まる…」
そんなあなたは『解法の型・流れ』を理解できていないのです。材料力学は色々な問題がありますが、実は決まった型に沿って解くことができ、この型こそが材力の基礎であり極意であると言えます。
このnote記事は、本ブログ管理人のぽるこが「材料力学の問題を解く上での型・要点・コツ」を本気でまとめあげました。かなりの大ボリュームかつエッセンスを詰め込んだものですが、1,200円という映画1本分にも満たない価格設定としました。
本ブログに書ききれていない内容も多く含んでおりますので、ぜひ読んでみてください!
Before jumping into specific patterns, let’s start with the most fundamental relationship between SFD and BMD.
Here’s the key idea you absolutely need to understand:
What does this mean?
At any given position, the slope of the BMD is equal to the value of the shear force F in the SFD at that same position.
You can derive this relationship mathematically, but most people aren’t too interested in the proof—so we’ll skip it here.
For now, just remember this:
With that in mind, let’s look at some typical patterns and see how this relationship actually shows up in practice.
Now that we understand the fundamental relationship, let’s take a look at how different types of loads acting on a beam appear in the SFD and BMD.
Once you understand all of these patterns, you’ll be able to predict the general shape of the diagrams without doing detailed calculations.
It also makes it much easier to quickly check whether your solution is reasonable or not.
So make sure you get comfortable with these—they’ll save you a lot of time later.
Let’s start with the simplest case—a region where no load is applied at all.
In most problems, a large portion of the beam falls into this category.
That means a large part of the SFD and BMD will follow the pattern shown below.
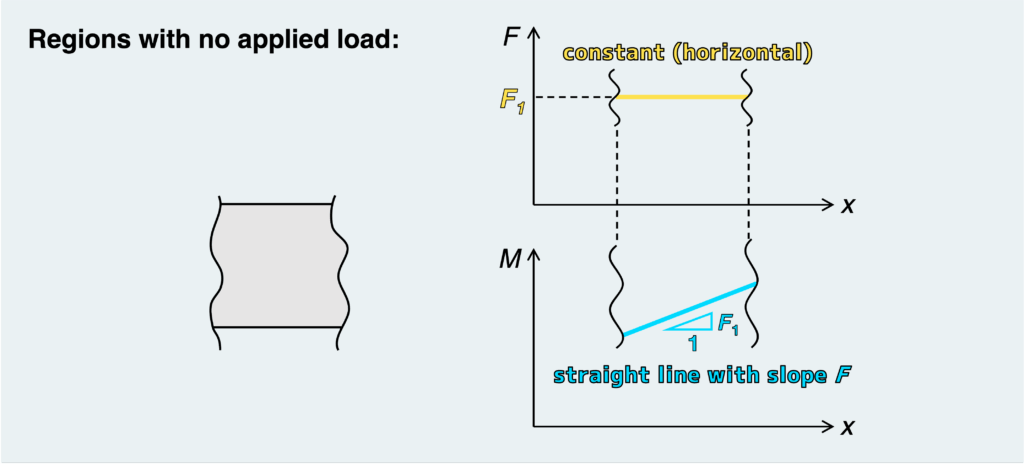
For the SFD, there is no change, so it becomes constant (horizontal).
The actual value (shown as F1 in the figure) depends on external forces and support conditions elsewhere on the beam.
However, regardless of the value, the key point is that it remains constant.
Now, recall the fundamental relationship:
the slope of the BMD equals the shear force F.
Since the SFD is constant (in this case, F1), the BMD becomes a straight line with slope F1.
Next, let’s consider what happens when a point load is applied.
When a point load acts downward at a specific location, the SFD and BMD around that point look like this:
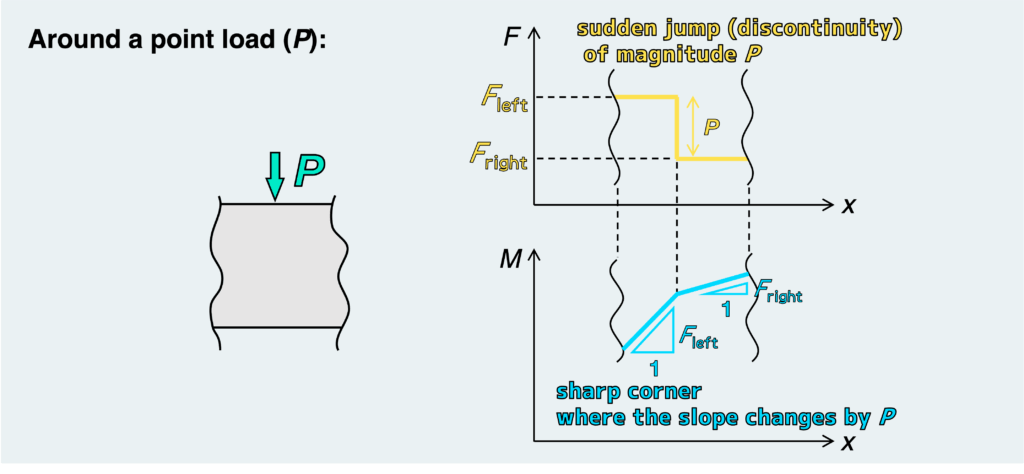
For the SFD, there is a sudden jump (discontinuity) at the exact point where the load is applied.
The magnitude of this jump is equal to the load itself, P.
The actual values on each side (such as Fleft and Fright in the figure) depend on other external forces and support conditions.
Now, for the BMD.
From the fundamental relationship—the slope of the BMD equals the shear force F—we can understand what happens here.
Since the SFD changes abruptly (by P) at that point, the slope of the BMD must also change abruptly.
On the left side, the slope is Fleft.
On the right side, the slope is Fright.
As a result, the BMD shows a sharp corner at the location of the point load.
Next, let’s consider the case where an external moment is applied.
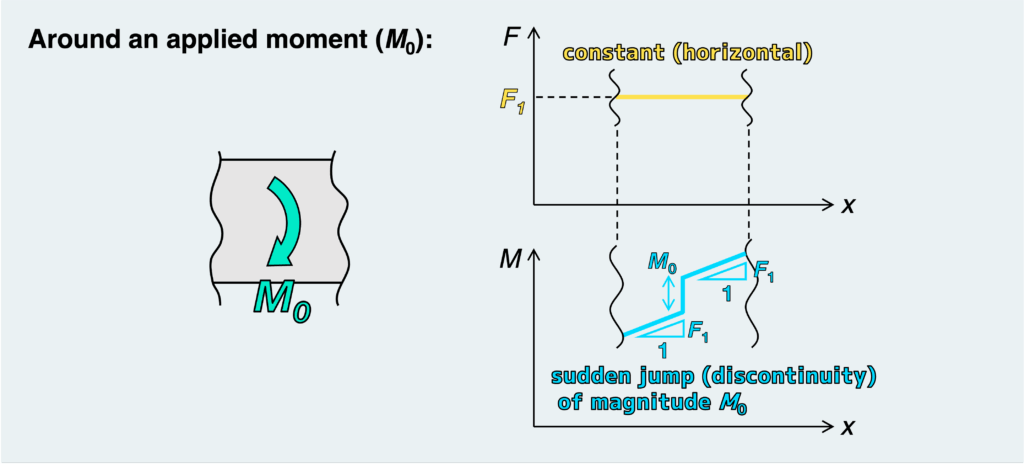
For the SFD, there is no change.
Just like in regions with no applied load, it remains constant (horizontal).
The actual value (shown as F1 in the figure) is determined by external forces and support conditions elsewhere on the beam.
Now, what about the BMD?
Since the SFD is constant, the BMD must again be a straight line with slope F.
However, there is one key difference compared to the no-load case.
At the point where the moment M0 is applied, the BMD shows a sudden jump (discontinuity).
In the previous case (point load), the discontinuity appeared in the SFD.
This time, it appears in the BMD instead.
Importantly, the slope of the BMD does not change on either side of this point.
It remains constant (in this case, F1) on both sides.
Finally, let’s consider the case where a distributed load with intensity q is applied.
Among all the cases, this one produces the most complex shape in the SFD and BMD.
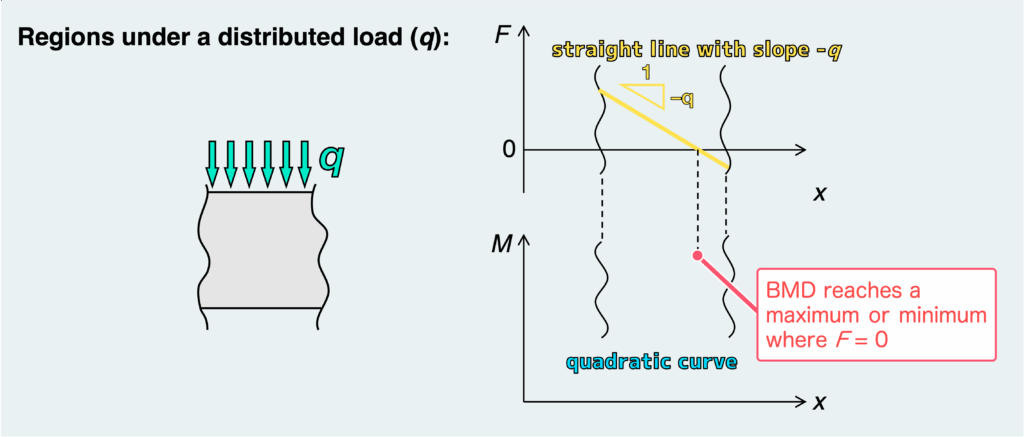
For the SFD, over the entire region where the distributed load acts, it becomes a straight line with slope −q (assuming no other loads).
As in the previous cases, the vertical position of this line depends on other external forces and support conditions.
Now, for the BMD.
Since the SFD changes continuously, the BMD becomes a quadratic curve.
When drawing this curve, it’s important to make sure that the relationship between the SFD and BMD is correctly reflected—that is, the slope of the BMD must match the value of F in the SFD.
For example:
- When F is positive in the SFD, the BMD must have a positive slope, so the moment M increases
- As F approaches zero, the slope of the BMD must also approach zero
- At the point where F = 0, the BMD must have zero slope, meaning it reaches a maximum or minimum
Take a close look at the figure and make sure you understand how this relationship appears in the diagrams.
In this article, we explored how different types of loads acting on a beam appear as distinct patterns in the SFD and BMD.
Once you understand these four patterns, you should be able to predict the general shape of the diagrams without detailed calculations, no matter the problem.
In practice, you may encounter more complex loading conditions.
However, they can always be broken down into a combination of the basic patterns introduced here.
Make sure you fully understand these concepts so that you can draw SFDs and BMDs quickly and accurately.
In the next article, we’ll go through several practical examples—so you can see how these patterns actually appear in real problems.
How to Draw SFD & BMD: Worked Example and Step-by-Step Solution
How Different Loads Appear in Shear Force and Bending Moment Diagrams (SFD and BMD)
How to Draw Shear Force and Bending Moment Diagrams (SFD & BMD) Step by Step
Shear Force Diagram & Bending Moment Diagram (SFD/BMD): What They Are and Why They Matter
- The most fundamental relationship: The slope of the BMD equals the shear force (F) in the SFD at the same position.
- Regions with no applied load: The SFD is constant (horizontal), and the BMD is a straight line with slope F.
- Around a point load (P): The SFD shows sudden jumps (discontinuities) of magnitude P, and the BMD has a sharp corner where the slope changes by P.
- Around an applied moment (M₀): The SFD remains constant (horizontal), while the BMD shows sudden jumps (discontinuities) of magnitude M₀.
- Regions under a distributed load (q): The SFD is a straight line with slope −q, and the BMD becomes a quadratic curve.
渾身のnoteを書きました!!
「公式は覚えてるのに問題を見たら手が止まる…」
そんなあなたは『解法の型・流れ』を理解できていないのです。材料力学は色々な問題がありますが、実は決まった型に沿って解くことができ、この型こそが材力の基礎であり極意であると言えます。
このnote記事は、本ブログ管理人のぽるこが「材料力学の問題を解く上での型・要点・コツ」を本気でまとめあげました。かなりの大ボリュームかつエッセンスを詰め込んだものですが、1,200円という映画1本分にも満たない価格設定としました。
本ブログに書ききれていない内容も多く含んでおりますので、ぜひ読んでみてください!